Pilot and mechanic seem always to be very busy on team race day. Not too hard to understand I guess. They have to count laps, watch needle setting and dash around 2 other guys every 1.6 seconds! Not to mention a DQ if they don't smile at the jury foreman. Also DQ for taking off under a landing model, whipping, high flying, foot placement outside circle, mechanic drunk...hell, why bother to start the engine!
Even so, we aussies have produced the last 2 World Champs winning teams, so I thought I might give this years brood some tips on flying team race! Mind you, it is 50 years since I last flew T/R, with an Eta Elite in a 27 oz model. Didn't run too well with the rear disc drive pin placed in the air intake, but it sure fired a lot.
So here is an off-line method of evaluating performance, where the laps and speed can be found in comfort in an armchair. All you need is a tape recorder (or any sort of sound recorder) and a computer which will run Spectrogram.
Place the recorder 2m to the windward side of the pilot, in the middle of the circle.
Turn it on and forget it. Although maybe it would be nice to tell the recorder what you are doing/have just done. Purely as a reminder, in case you forget.
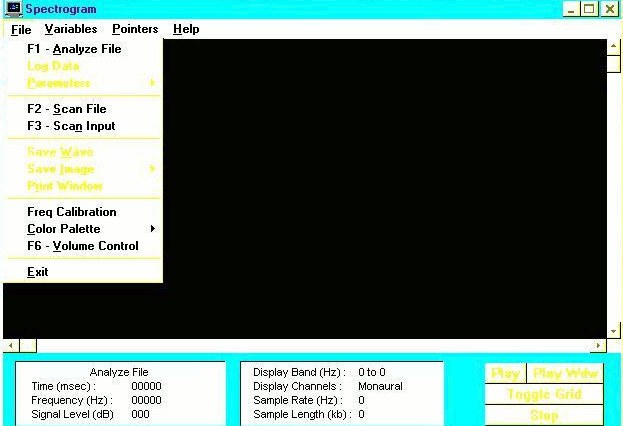
When you are done flying, connect your recording device into your computer soundcard, then fire up Spectrogram as follows. Refer to Figure 1.

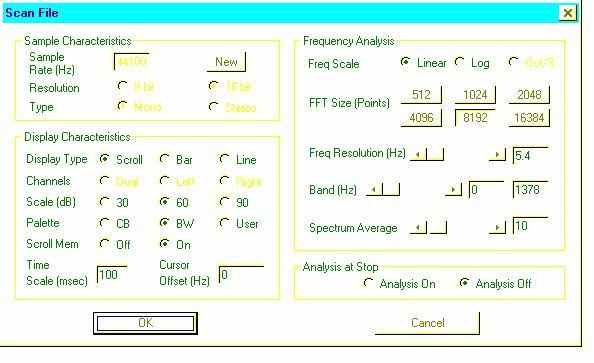
Click on File and choose either F2 or F3, but most likely F3. (F2 is for wav files already stored by Spectrogram). Another screen will pop up, requiring you to choose your analysis settings. Make everything the same as I have in Figure 2. Works for me!

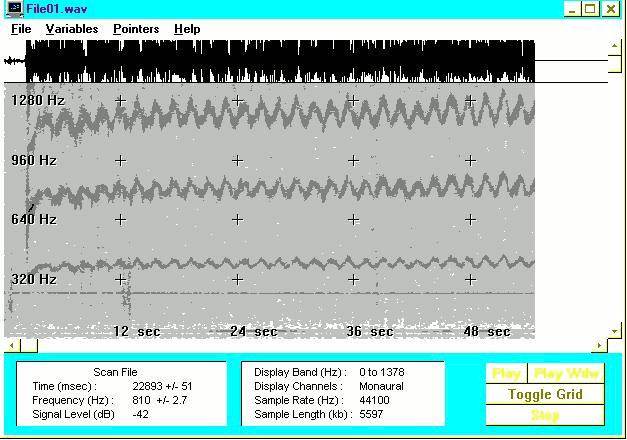
Click OK, and with the recorder playing, you will see wavy traces like in Figure 3. When the screen is full, click on Stop, and maybe even Toggle Grid (just for fun)

Those wavy lines have a story to tell. They are wavy because the sound that made them is Doppler shifted a little. That is why the recorder was placed off centre: we can now see individual laps appearing, hopefully at least 34 if this is F2C. In this case, we have 3 wavy lines: they are all in fact the same trace, but moved apart. They are harmonics, numbers 1 to and 3. The upper (third) harmonic is easiest to see, so where from here?
Well, we want the time for 10 laps. In figure 3, lower left, is the "Scan File" box. It has a clock marked "Time (msec):", and it is every bit as good as a stopwatch. Place the cursor on one peak, read the clock, then count along 10 laps with the cursor and read the clock again. subtract the first time and you have the time for 10 laps with great accuracy. Since 10 laps is one kilometre, you also have the speed!
Also in the "Scan File" box is "Frequency (Hz):". Choose a peak on a given lap, place the cursor there, and read the frequency. For the same lap, read the frequency at the bottom of the peak. Average the 2 readings and divide by 3 (we are using the third harmonic). Now multiply by 60 and you have the RPM!
So from this one figure, you get lap times, airspeed, RPM and number of laps flown under power. Pretty cool! Finally, if you are worried about engine overheating, get the RPM at each lap, and plot them on a graph. They are a bit rough in terms of scatter, but smooth them out by eye and see what you can in terms of engine loading.
Now, wot other tips can I give these youngsters? |