In the earlier parts of this series, the notion of zero-lift angle recurs. An accurate estimation of the zero-lift angle of a wing section is the starting point for the propeller design. In this Part 7 of the series, we revisit the zero-lift angle and examine its relationship to airfoil camber. Not least, we need a method for deriving the zero-lift angle of our chosen sections.
We will start with the dictionary definition of camber, viz "the slightly convex or arched shape of the surface of an …aircraft wing" [reference 1]. OK, the wing section is usually a bit bent. Not always, a flat plate has no bent; we say the camber is zero.
Examine Figure 1 below. This shows the flow over the famous Clark-Y airfoil section,

This airfoil is set at an angle of 2.34 degrees to the free-stream. The point of interest here is that the dividing streamline, which ends at the stagnation point, meets the camber-line exactly. This condition appears to be that of the "ideal" angle of attack, as noted by Theodorsen.
Figure 2 is the same again, but this time the angle of attack is 10 degrees. Note that the stagnation point is below the camber line: indeed, it is some distance behind the leading edge on the lower surface. Seems to me, this could be called "non-ideal"!
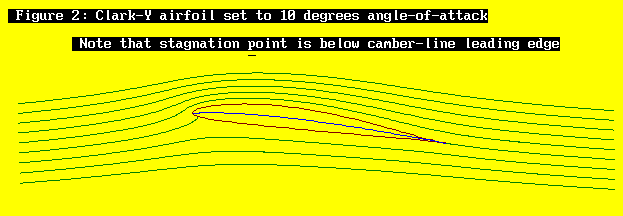
Figure 3 shows the airfoil tilted down. The streamlines shown in these figures were generated using the "Oshkosh program" [Reference 2], which is based on the Jones-Joukowsky conformal tranformation of the flow around a cylinder into that around an airfoil.

The chord-line is angled down from the free-stream flow by –3.54 degrees. In this position, the section produces no lift, so the –3.54 degrees is the zero-lift angle. Also on the figure, there is a line splitting down the middle of the section. This line is the camber-line, also called the mean-line. The shape of this line is of great importance, as it determines the zero-lift angle and the pitching moment. Note that the stagnation point lies above the leading edge of the camber-line.
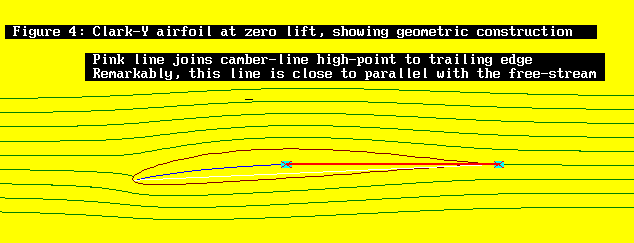
Figure 4 is just the same as Figure 3, except that a line has been added which connects the camber high-point to the trailing edge. This line, shown in pink, has the surprising property that it is very much parallel with the free-stream flow. This suggests a way in which the zero-lift angle may be found Figure 5 attempts to show more clearly the geometry of this situation.
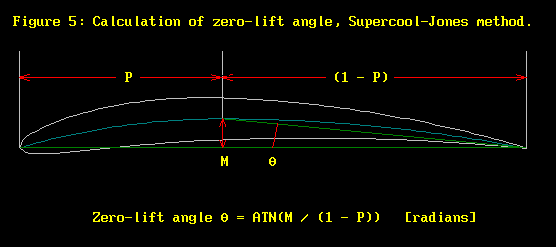
The maximum height of the camber-line above the chord-line is called, by definition, the camber. The position of this camber-line high-point chord-wise is also of great interest.
We will call the camber "m" and the position of its high-point as "p".
By my reckoning, these 2 parameters can be used to get the zero-lift angle by this formula:
Zero-lift angle (radians) = tan-1 (m / (1 - p)) [Supercool/Jones formula]
This is a pretty brave assertion. The purpose behind this article is to justify the use of this formula: other methods are available, best of all being to stick the airfoil into a wind-tunnel and measure the zero-lift angle!
We will start back with our old favourite, Clark-Y. The value quoted above came from the Jones-Joukowsky Oshkosh airfoil program, as did the flow streamlines in Figures 1, 2 and 3. The Oshkosh program [reference 2] is entirely theoretical in nature, no empirical measurements at all! Don't let the armchair nature of this form of aerodynamics fool you. The mathematical tools of theoretical Fluid Dynamics provide very powerful (read accurate) descriptors of the real world.
Clark-Y has camber parameters m = 3.55 % and high-point p = 42%. From these the Supercool formula gives zero-lift angle –3.50 degrees. The value from the Oshkosh program was –3.54 degrees, so we are close. The NACA 4412 section is close to Clark-Y, and zero-lift angle –3.7 degrees (from reference 5).
There is a trap in all this. The data above apply for low Mach numbers (<0.3) and high Reynolds numbers (>1,000,000). I have shown previously how to handle the effect of compressibility on camber, but nothing on the effect of Reynolds number. The Prandtl-Glauert rule does a good job on compressibility, but I am not aware of a similar simple way of handling Reynolds number effects. The thing we are up against here is viscosity, a property ignored in simple treatments of flow.
Back around 1988, Selig, Donovan and Fraser carried out wind tunnel test for a large range of airfoils at low Reynolds numbers. These tests were published by Herk Stokely in Soartech 8. Luckily, at the time, I purchased both Soartech 8 [reference 3] and the accompanying floppy disc.
The result for Clark-Y was quite worrying. The zero-lift angles for Reynolds numbers 200,000, 100,000, and 60,000 were –3.9, -3.5 and –2.0 respectively.
This kind of blows a hole in the Supercool formula. These Reynolds numbers are right in the range of design for model airplane propellers. We must proceed with caution.
But let us not be timid. Note that Reynolds number Re is given by:
Re = ρ.V.L / μ
where ρ = air density, V = airspeed, L = chord length and μ = viscosity.
and ρs / ρ = [ 1 + M2 / 5 ] 2.5 (reference 4)
where ρs = air density at the stagnation point, and M is the Mach number.
This suggests to me that Re at higher Mach numbers may be increased due to compressibility. At Mach .95, the increase is by a factor of 1.5. In the case of F3D and F2A racing propellers, the Reynolds number may not fall too far below 200,000, in which case the Supercool/Jones formula could be acceptable.
Well that seems good for Clark-Y, which is quite an acceptable propeller airfoil: what about some others? Well, Soartech 8 has plenty of sections to choose from, all with wind-tunnel data for the zero-lift angle. The camber for these airfoils is given, but not the camber-line high-point. Frustrating. To cut a long story short, I adopted the definition of camber-line used by NACA, and described in Abbott and von Doenhoff [reference 5]. These authors warn "the mean line of an arbitrary wing section is rather difficult to obtain, [but] the construction of cambered wing sections from given mean lines and symmetrical thickness distributions is relatively easy". They weren't kidding, but me and my little CPU figured it out.
A problem with the Soartech 8 data is the small number of points used to describe the airfoil surface. The leading edge, in particular, where maximum curvature occurs, has only about 4 or 5 points. This makes determination of the camber-line in the region of the leading edge fraught. Perhaps it is worth a brief description of my method of applying the NACA definition of camber line, if only as a caution to others.
The problem is that the NACA method is a geometric construction, which requires that the camber line be specified before drawing the airfoil. Neat trick, but it means that no formal definition is given as to what we mean by "camber-line". This must be remedied before we can proceed further.
First we must write an expression for the upper ηu and lower ηl airfoil surfaces. Katz and Plotkin [reference 6] give
z = ηu (x,y) (4.18a)
z = ηl (x,y) (4.18b)
These equations are related to Figure 4.2, page 76 [reference 6]. This latter figure shows the surface contour functions and camber-line as referenced to normals drawn from the chord-line. This is unfortunate for 2 reasons. The first is that the definition of camber-line so implied is not the same as the NACA, where the normals are drawn from the camber-line. Secondly, the theory which allows for calculation of the zero-lift line applies to the NACA definition of camber-line, not this one. As it happens, the 2 are quite close in practice, but the error is not stated. We must evaluate the error.
To evaluate this error, we need to construct the camber-line from the surface functions z above.
We need to add another equation, this time for the camber-line, viz
zc = ηc (x,y)
The property which defines the camber-line is then the angle tan-1 (∂ηc / ∂x) where
tan-1 (∂ηc / ∂x) = [ tan-1(∂ηu / ∂x) + tan-1(∂ηl / ∂x) ] / 2
The surface derivatives are taken on a line normal to and intersecting a chosen point on the camber-line. The slope of this normal is the negative reciprocal of the above, and the point on the camber-line is the bisector of the line segment joining the upper and lower surfaces. These values can be readily computed by running down the surfaces until the conditions above are met.
Did I say readily? Another Supercool lie, but I guess you are used to those by now. Well, I did say that the finding of the camber-line is fraught: so why?
There are simply not enough points in the Eppler formatted data to get a smooth representation of the camber-line. I found it useful to quadruple the number of surface points using quadratic Newtonian interpolation. The same interpolation routine was useful for finding the tangent angle at each surface point, from additional points close to and either side of the chosen point. This yielded some interesting gymnastics at the leading edge, with the disappointing result that the camber-line so found in the close vicinity of the leading edge had some uncertainty: which I chose to live with. More anon about that.
I can see why the less accurate but more commonly stated version of camber-line as used Katz and Plotkin [reference 6] and many others is so attractive. This is to take the simple average of points normal to the chord-line. Piece of cake. As it turned out in the end, this approximation is not too bad.
However, there is a problem. The AvD camber-line (Abbott and von Doenhoff of NACA) does not pass through the leading edge. It lies below the leading edge for a positive camber airfoil. The angle thus formed with the leading is of the order 0.2 degrees for an airfoil with 6% camber, a non-negligible amount. A correction may be required.
Well the zero-lift angle is referenced to the chord-line as datum, but the methods of calculating zero-lift angle are based on the camber-line as reference.
One of the methods is that of Glauert, given in AvD [reference 5, chapter 4]. We will use this method as part of our armamentarium in finding the true zero-lift angle. Or at least the best, if there is one.
Figure 6 is not designed to confuse, but it may well do. You see, not only is the camber-line loosely defined in the texts, but so is the chord-line. Most people would think a line joining the far leading edge and the remote trailing edge might be a useful definition of the chord-line. I mean, the average mortal has a fair chance of finding these points with simple tools, even the Mark 1 eyeball. It could be useful if you were trying to set up in a reproducible fashion an airfoil in a wind tunnel.
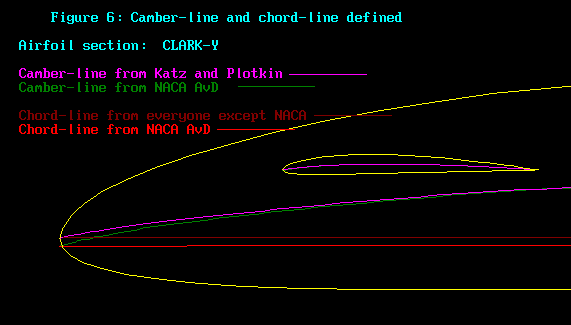
But not NACA. They actually take the chord-line to be concurrent with the camber-line leading edge extremum! Look closely at Figure 6, the lunacy is all there to see. The angle between the 2 chord-lines comes in around 0.1 to 0.2 degrees, depending on the camber-line profile. Small amounts indeed, but these angles feed straight into the uncertainties in finding the zero-lift angle: very norty indeed!
Figure 6 also shows the difference in the leading edge camber-lines. These differences also feed directly into the Glauert integrations which yield the zero-lift angle; we do need some rigour, at least in definition, of both the camber-line and chord-line of an arbitrary airfoil.
Now to move on. I wrote a code which took the Soartech 8 data and determined the camber and camber-line high-point for each of the airfoils, in all their 125 forms. Also, I extracted the wind-tunnel determined zero-lift angle for a range of airfoils, at Reynolds numbers of 300,000, 200,000 and 100,000.
Here is a selection of these Soartech 8 airfoils with their data. The data in the last 3 columns are the zero-lift angles as measured in the wind tunnel for the above Reynolds numbers.
| |
Reynolds number |
| Section |
Camber |
p |
tan-1(m / (1-p))
(degrees) |
300000 |
200000 |
100000 |
| Clark-Y |
.0355 |
.42 |
-3.5 |
-3.8 |
-3.8 |
-3.0 |
| FX63 |
.0595 |
.52 |
-7.0 |
-6.7 |
-6.7 |
|
| E193 |
.0357 |
.40 |
-3.4 |
-2.9 |
-2.8 |
-2.7 |
| RG15 |
.0176 |
.40 |
-1.7 |
-2.3 |
-1.8 |
-1.3 |
| NACA6409 |
.06 |
.40 |
-5.7 |
- |
-6.7 |
-5.8 |
| S3016 |
.021 |
.38 |
-1.9 |
-1.7 |
-1.8 |
-1.4 |
| SD7003 |
.015 |
.33 |
-1.3 |
-1.9 |
-1.7 |
-1.4 |
| SD8000 |
.0171 |
.48 |
-1.9 |
-3.3 |
-3.0 |
-2.4 |
| E205 |
.030 |
.35 |
-2.7 |
-2.2 |
-2.2 |
-2.7 |
| MB253515 |
.024 |
.375 |
-2.2 |
-2.5 |
-2.5 |
-2.1 |
| AQUILA |
.040 |
.338 |
-3.5 |
-4.0 |
-4.0 |
-4.0 |
| DAE51 |
.040 |
.47 |
-4.3 |
-5.1 |
-5.1 |
-3.8 |
SPICA
|
.047 |
.35 |
-4.2 |
-2.3 |
-2.3 |
-2.3 |
Hmm, bit of a mixed bag here. Some of these Soartech figures suggest strange happening in the wind tunnel. Whatever, you be the judge.
Column 4 is the zero-lift angle by the Supercool/Jones method. Columns 5, 6 and 7 show the effect of Reynolds number in the wind-tunnel data.
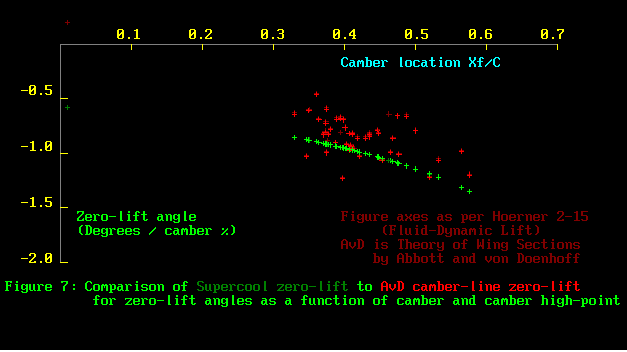
Figure 7 is a rather odd graph, but it has good lineage. This is one for the true believers. The axes are straight out of Figure 25 in Dr.-Ing. S.F. Hoerner's 1975 edition of Fluid-Dynamic Lift [reference 7]. The plotted data, by contrast, are mine.
The pink crosses are calculations of the zero-lift angle (divided by camber) using the method of Glauert. The camber-line and high-point values used are mine derived from the Soartech 8 airfoil profiles data.
The green crosses are the zero-lift angles derived from the Supercool/Jones formula. It would have been nice if the scatter in the pink values was not there. . The Glauert method does not yield a simple connection between zero-lift angle, camber and camber high-point. So we need to look more closely
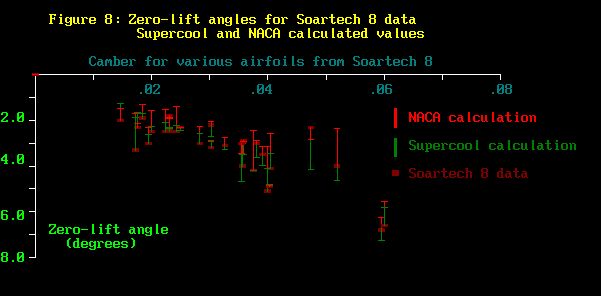
Figure 8 is perhaps more easily read. The vertical axis is simply zero-lift angle, which is always negative (mostly). The horizontal axis sorts the Soartech 8 airfoils by camber. The general trend is for the zero-lift angle to become more negative as camber increases, but there is still a lot of scatter. Remember that the Soartech data are real measurements from the wind-tunnel. The NACA and Supercool figures are by calculation. Again, the scatter is too high: the uncertainty in the zero-lift angle is really unacceptable.
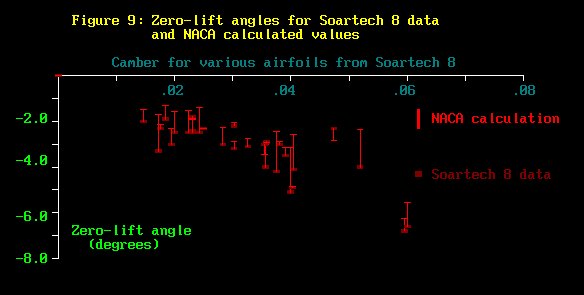
Figure 9 plots only the Soartech tunnel data and Glauert (NACA) calculations.
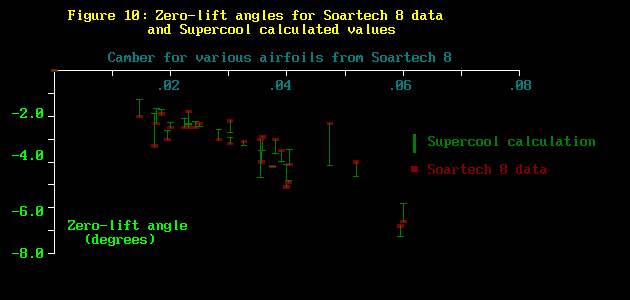
Figure 10 graphs only the Soartech data and Supercool/Jones calculations. The value for the Soartech data at camber .047 is for the SPICA airfoil. This value is anomalous. SPICA is really a version of Clark-Y with increased leading edge camber. How this could make the zero-lift angle more positive by such an amount defies interpretation, or even belief!
Ignoring SPICA, the Soartech data are, in the round, more negative than the theoretical calculated values. Also, the NACA data are more positive than all the values. The Supercool/Jones values lie intermediate between the Soartech and NACA figures
All the values indicate uncertainty in zero-lift angle of the order of 1 degree or more, a very unsatisfactory state of affairs from the propeller designers point of view.
One could suggest that there exists a bias in the Soartech data, making the zero-lift angles about 1 degree too negative.
Now for a summary.
1. Soartech 8 states camber values for each airfoil, but does not define camber.
2. This would not be a problem if there weren't more than one way of defining camber. But there are 2. In textbooks, right up to 2001 [reference 6], the camber line is simply taken as the sum of upper and lower surface points divided by 2. Easy, but the so called "mean-line" is way off near the leading edge.
3. This error means that the camber angle at the leading edge is quite wrong. Turbine blade designers like to use this angle, plus that at the trailing edge, to get the "turning angle" for the section [reference 8, page114]. A shame if the leading edge camber angle is wrong. That is an application of Theodorsens "ideal" angle of attack.
4. The NACA definition seems preferable to me. For an arbitrary section, such as those in Soartech 8, the camber-line can be found by computer, with sufficient accuracy, by applying a rigorous definition as given earlier in this work.
Sorry, not done yet. So far we have only used the Soartech 8 data and my pathetic little zero-lift formula. We might as well see if Glauert's thin-airfoil method for generating camber-lines, then determining their zero-lift angle, makes a good fit with the measured data or validates the Supercool formula.
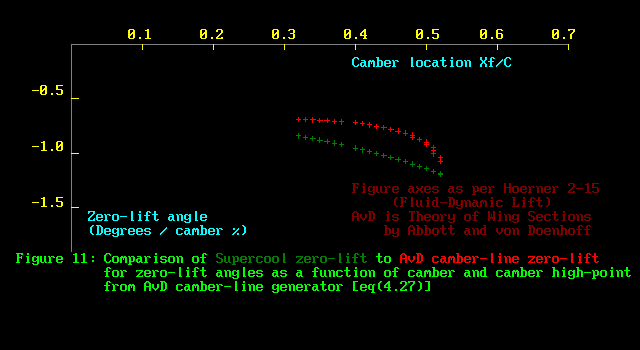
Figure 11 reverts to the Hoerner axes, for the purpose of comparing Supercool/Jones formula to the camber-lines generated by Glauert [ AvD, eq.(4.27)]. Still no agreement.
Conclusions.
1. The terms camber-line and chord-line are poorly treated in the literature.
2. The Soartech 8 data for zero-lift angle appear to have a systematic displacement to be 1 degree more negative than expected
3. The Soartech 8 data for the SPICA airfoil are anomalous .
4. The scatter apparent in all methods is of the order of 1 degree. This degree of uncertainty has a serious deleterious effect in propeller design, especially at the tips where blade angles are typically low.
5. The Supercool/Jones formula is primitive, using only 2 parameters from the whole camber-line. Even so, there is no indication in the data that it is inferior to the NACA and Soartech data
6. The Soartech 8 publication is essentially a presentation of results, not a discussion of experimental techniques. It would be informative to find how the values of camber and section thickness were obtained. One also wonders if inverting the sample airfoils in the tunnel flow would give the same zero-lift angles as when upright. There is no description of how the airfoils were aligned with the tunnel flow.
7. The propeller designer is faced with the need for data not required by the wing designer. Data for angles of attack past the stalls, over the full range of 360 degrees are useful. For example, in a vertical dive with the engine idling, the prop can and does generate reverse thrust. I found a small amount of data by Reigel.
References:
1. The Concise Oxford Dictionary, 1991.
2. Modern Subsonic Aerodynamics. R. T. Jones. Published by Martin Hollmann, Aircraft Designs Inc. 1988
3. Airfoils at Low Speeds. Soartech 8. Michael S. Selig, John F. Donovan and David B. Fraser. H. A. Stokely, publisher. 1989.
4. Aerodynamics for Engineering Students. Houghton and Brock. 1960.
5. Theory of Wing Sections. Ira H. Abbott and Albert E. von Doenhoff, 1959. Dover Publications.
6. Low-Speed Aerodynamics. Joseph Katz and Allen Plotkin. 2001. Cambridge University Press.
7. Fluid Dynamic Lift. Dr.Ing. S.F.Hoerner and H.V.Borst. 1975. Published by Mrs. Liselotte A. Hoerner.
8. Gas Turbines for Aircraft. F.W.Godsey and Lloyd A.Young.1949. McGraw Hill Book Company, Inc. |